Automatic Instrumentation of a Go application using Opentelemetry
In a microservices based architecture, we have multiple services communicating with each-other. Observability tools give the developers the power to observe how these services are actually interacting.
Observability uses instrumentation to provide insights that aids monitoring. In other words, monitoring is what you do after a system is observable.
An observable system helps understand and measure the internals of a system, so that one can easily track development bugs and issues in a complex microservice architecture. In short, the importance of observability especially tracing, which is one of its most important pillar cannot be understated.
We have covered observability and tracing in our previous article here.
Before we proceed ahead implementing automatic instrumentation of a Go application using Opentelemetry, let's understand about the importance of context and propagation in distributed tracing.
Context and its Propagation
The ability to correlate events across service boundaries is one of the principle concepts behind distributed tracing. To find these correlations, components in a distributed system need to be able to collect, store, and transfer metadata referred to as context.
A context will often have information identifying the current span and trace, and can contain arbitrary correlations as key-value pairs.
Propagation is the means by which context is bundled and transferred in and across services, often via HTTP headers. Together, context and propagation represent the engine behind distributed tracing.
Context is injected into a request and extracted by a receiving service to parent new spans. That service may then make additional requests, and inject context to be sent to other services…and so on.
There are several protocols for context propagation that OpenTelemetry recognizes.
The following diagram takes a high-level look at the context propagation architecture in OpenTelemetry.

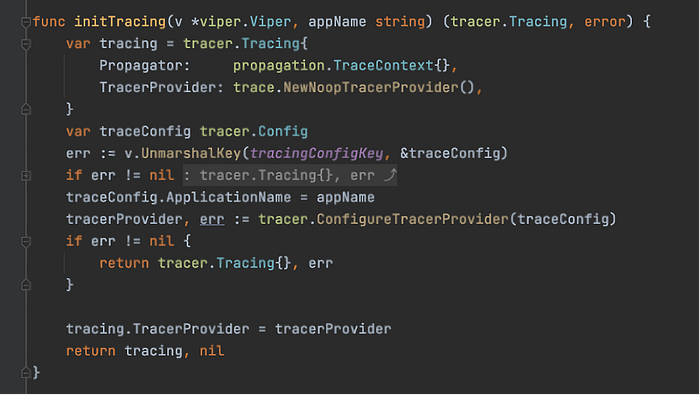
Inside the application, first initialize the tracing using the initTracing function as explained in our article here. The initTracing function returns a tracing object based on the tracing configuration.


The tracing object returned is an object of type Tracing. It contains the tracer provider configuration as well as the context propagator.

Auto instrumenting mux router in a Go application
For auto instrumenting the mux router, we inject the tracer provider and propagator from our tracing object into the otelmux middleware function.

Also, we inject the utility function EchoFirstNodeTraceInfo that captures the trace information from the request and writes it back in the response headers if the request is the first one in the trace path. This ensures the context propagation across services.

Auto instrumenting http client in a Go application
The auto instrumentation of HTTP client is pretty much similar to the mux router. We inject the tracer provider and propagator from our tracing object into the otelhttp middleware function.

Extracting traceID and spanID from the span context
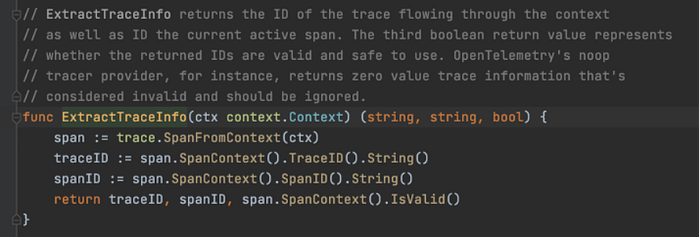
The traceID and spanID are extracted using the helper function ExtractTraceInfo(ctx) provided by tracer utility.


Auto Instrumentation Demo in our sample application
Following is the simple flow diagram for our HTTP 1.1 request that spans across 2 microservices: Service A and Service B.

The request flow consists of a request made to Service A, that’s running on our localhost on port 8000.

This request in turn redirects the request to service B running on port 8001 using the request handler of Service A.

In summary, a request is made to http://localhost:8000/, the address on which our Service A is running. This request in turn redirects the call to http://localhost:8001/, the address on which our Service B is running.
Tracking the request flow
The logs of Service A when the request hits it is as follows. It shows the traceID and spanID for the request flowing across Service A.

This request when redirects to Service B, the logs are generated by the request interceptor middleware as well as when it is completely processed in Service B.

The logs from Service B below show the headers received from Service A in Service B. Also, it shows the traceID and spanID for the request flowing in Service B. Clearly, we can see the same trace ID 7a96a6bcd6ef32c413ca1366fb47c597 flowing across through entire lifecycle.

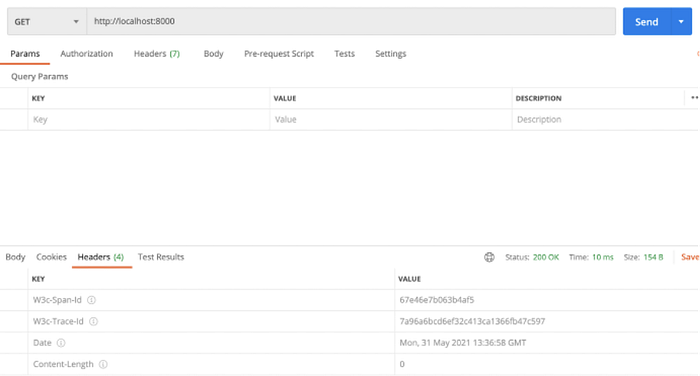
Following are the headers received in postman on request completion.

Bingo! We see the same trace ID 7a96a6bcd6ef32c413ca1366fb47c597 flowing through our request from start to end.
The whole project can be accessed using the git repositories for Service A and Service B.
Note: This article has been co-authored by Sachin Narang
References:
https://coralogix.com/blog/how-to-address-the-most-common-microservice-observability-issues/
https://thenewstack.io/monitoring-vs-observability-whats-the-difference/
https://opentelemetry.io/docs/
https://opentelemetry.lightstep.com/core-concepts/context-propagation/
